
위 분석 방법은 정확한 내용이 아닌 테스트를 통해 개념정리입니다.
테스트 환경
- OS : Centos 7.9
- DB : Oracle 11.2.0.4
테스트 시나리오
- enq Tx - row lock entention 발생시킴
- dba_objects 2개 이상 count로 조회하여 강제 I/O 발생
- oradebug로 trace 로그 분석
=> oradebug는 경우에 i/o를 많이 잡아먹기때문에 DB가 멈출수 있어 잦은 발생보다 필요로할때 추출하는 것이 제일 best
oradebug commands
SQL> oradebug help

HELP           [command]                 Describe one or all commands
SETMYPID                                 Debug current process
SETOSPID       <ospid>                   Set OS pid of process to debug
SETORAPID      <orapid> ['force']        Set Oracle pid of process to debug
SETORAPNAME    <orapname>                Set Oracle process name to debug
SHORT_STACK                              Get abridged OS stack
CURRENT_SQL                              Get current SQL
DUMP           <dump_name> <lvl> [addr]  Invoke named dump
PDUMP          [interval=<interval>]     Invoke named dump periodically
               [ndumps=<count>]  <dump_name> <lvl> [addr]
DUMPSGA        [bytes]                   Dump fixed SGA
DUMPLIST                                 Print a list of available dumps
EVENT          <text>                    Set trace event in process
SESSION_EVENT  <text>                    Set trace event in session
DUMPVAR        <p|s|uga> <name> [level]  Print/dump a fixed PGA/SGA/UGA variable
DUMPTYPE       <address> <type> <count>  Print/dump an address with type info
SETVAR         <p|s|uga> <name> <value>  Modify a fixed PGA/SGA/UGA variable
PEEK           <addr> <len> [level]      Print/Dump memory
POKE           <addr> <len> <value>      Modify memory
WAKEUP         <orapid>                  Wake up Oracle process
SUSPEND                                  Suspend execution
RESUME                                   Resume execution
FLUSH                                    Flush pending writes to trace file
CLOSE_TRACE                              Close trace file
TRACEFILE_NAME                           Get name of trace file
SETTRACEFILEID <identifier name>         Set tracefile identifier
LKDEBUG                                  Invoke global enqueue service debugger
NSDBX                                    Invoke CGS name-service debugger
-G             <Inst-List | def | all>   Parallel oradebug command prefix
-R             <Inst-List | def | all>   Parallel oradebug prefix (return output
SETINST        <instance# .. | all>      Set instance list in double quotes
SGATOFILE      <SGA dump dir>         Dump SGA to file; dirname in double quotes
DMPCOWSGA      <SGA dump dir> Dump & map SGA as COW; dirname in double quotes
MAPCOWSGA      <SGA dump dir>         Map SGA as COW; dirname in double quotes
HANGANALYZE    [level] [syslevel]        Analyze system hang
FFBEGIN                                  Flash Freeze the Instance
FFDEREGISTER                             FF deregister instance from cluster
FFTERMINST                               Call exit and terminate instance
FFRESUMEINST                             Resume the flash frozen instance
FFSTATUS                                 Flash freeze status of instance
SKDSTTPCS      <ifname>  <ofname>        Helps translate PCs to names
WATCH          <address> <len> <self|exist|all|target>  Watch a region of memory
DELETE         <local|global|target> watchpoint <id>    Delete a watchpoint
SHOW           <local|global|target> watchpoints        Show  watchpoints
DIRECT_ACCESS  <set/enable/disable command | select query> Fixed table access
IPC                                      Dump ipc information
UNLIMIT                                  Unlimit the size of the trace file
CALL           [-t count] <func> [arg1]...[argn]  Invoke function with arguments
CORE                                     Dump core without crashing process
PROCSTAT                                 Dump process statistics
oradebug 사용법
ORADUBUG는 ORACLE에서 제공하는 디버깅을 위한 목적으로 만들어진 유틸리티로 DB가 멈추거나 Hang 상태일 때 또는 ORA-600 에러가 발생했을 경우, 특정 프로세스가 루핑을 도는 것 또는 멈춰있는 것 같이 보일 때 관리자 권한으로 실행하여 사용할 수 있다. 즉, 프로세스, 세션, 메모리, SQL 등의 리소스를 덤프할 수있고, OS 디버거들과 비슷하게 오라클 레벨에서 CALL단위 디버깅 기능을 제공한다. 리소스를 개별로 덤프할 수 있으며 인스턴스를 덤프할 수 있으며 DB HANG 또는 크리티컬 장애 분석 시 사용된다. 반드시 덤프할 오라클 프로세스를 지정한 후 사용
- 다른 유저 세션으로 SQL Tracing 설정 가능
- 프로세스 일시중단
- 공유메모리와 세마포어 정보검색
- 새로 생성된 트레이스파일 closing
- 내부 구조 조작 및 dump 기능
- 프로세스 시동
oradebug 작업 과정
1. oradebug setmypid : 현재 오라클 프로세스로 디버그
SQL> oradebug setmypid
Statement processed.
2. oradebug unlimit : trace file size 제한 없이 설정
=> I/O 를 사용하기에 필요한 상황 외는 no recommend
SQL> oradebug unlimit
Statement processed.
3. oradebug setinst all : rac의 경우 instance 2개 이상이므로 해당 옵션 사용 (single일때는 필요 없음)
SQL> oradebug setinst all
Statement processed.
4. oradebug hanganalyze : 프로세스 또는 인스턴스 hang 진단 및 분석시 유용
: oradebug hanganalze <level>
: rac의 경우 oradebug --g def hanganalyze 옵션 사용
<hanganalyze level option>
* 1-2 - Only HANGANALYZE output, no process dump at all
* 3 - Level 2 + Dump only processes thought to be in a hang (IN_HANG state)
=> hang으로 추정되는 프로세스 덤프
* 4 - Level 3 + Dump leaf nodes (blockers) in wait chains (LEAF,LEAF_NW,IGN_DMP state)
=> wait chain의 blocker 프로세스
* 5 - Level 4 + Dump all processes involved in wait chains (NLEAF state)
=> wait chain의 모든 프로세스
* 10 - Dump all processes (IGN state)
=> 모든 프로세스 덤프
SQL> oradebug hanganalyze 3 Hang Analysis in /ora_engine/diag/rdbms/ora11g/ORA11G/trace/ORA11G_ora_6187.trc
<Hanganalyze trace file sections 설명>
- CYCLES : Deadlock 관계 세션들의 CHAIN
- BLOCKER OF MANY SESSIONS : 10개 이상의 세션을 blocking 하는 BLOCKER 제시
- OPEN CHAINS : 1개 이상의 타 세션들을 blocking 하는 세션이 포함된 WAIT CHAIN
- OTHER CHAINS : OPEN CHAIN 의 세션들과 간접적으로 관련있는 프로세스 리스트
- EXTRA INFORMATION : 덤프 레벨에 따른 프로세스 Errorstack 등의 추가 정보
STATE OF NODES : 모든 세션들 DEPENDENCY GRAPH
- IN_HANG - HANG
- IGN - IGNORE
- LEAF - A waiting leaf node
- LEAF_NW - A running leaf node
- NLEAF - STUCK
[세션 STATE 설명]
- IN_HANG : 심각한 상태로, 이 상태의 세션은 DEADLOCK 가능성이 있음.
- IGN and IGN_DMP : IDLE 상태이므로 ignore
- LEAF and LEAF_NW : 이 상태로 Wait Chain 의 가장 앞에 있으면, 해당 세션이 Blocker 세션
- NLEAF : STUCK 세션으로, 다른 세션이 리소스를 잡고 안 놓아 주는 상태로 Performance 이슈 일 가능성이 높음
5. oradebug dump systemstate <level>
: hang에 대한 원인 파악이 가능하도록 dictionary table 에 대한 정보가 담겨져 있는 스냅샷
: rac의 경우 oradebug -g all dump systemstate 옵션 사용
: hanganalyze 수행 후 1분뒤 systemstate를 출력해야 정확히 수집 됨
= alter session set events 'immediate trace name systemstate level <level option>';
<systemstate level option>
2 : dump (not including the lock element)
10 : dump
11 :dump + global cache of RAC
256 : short stack (function stack)
258 : 256 + 2 -> short stack + dump (not including the lock element)
266 : 256 + 10 -> short stack + dump
267 : 256 + 11 -> short stack + dump + global cache of RAC
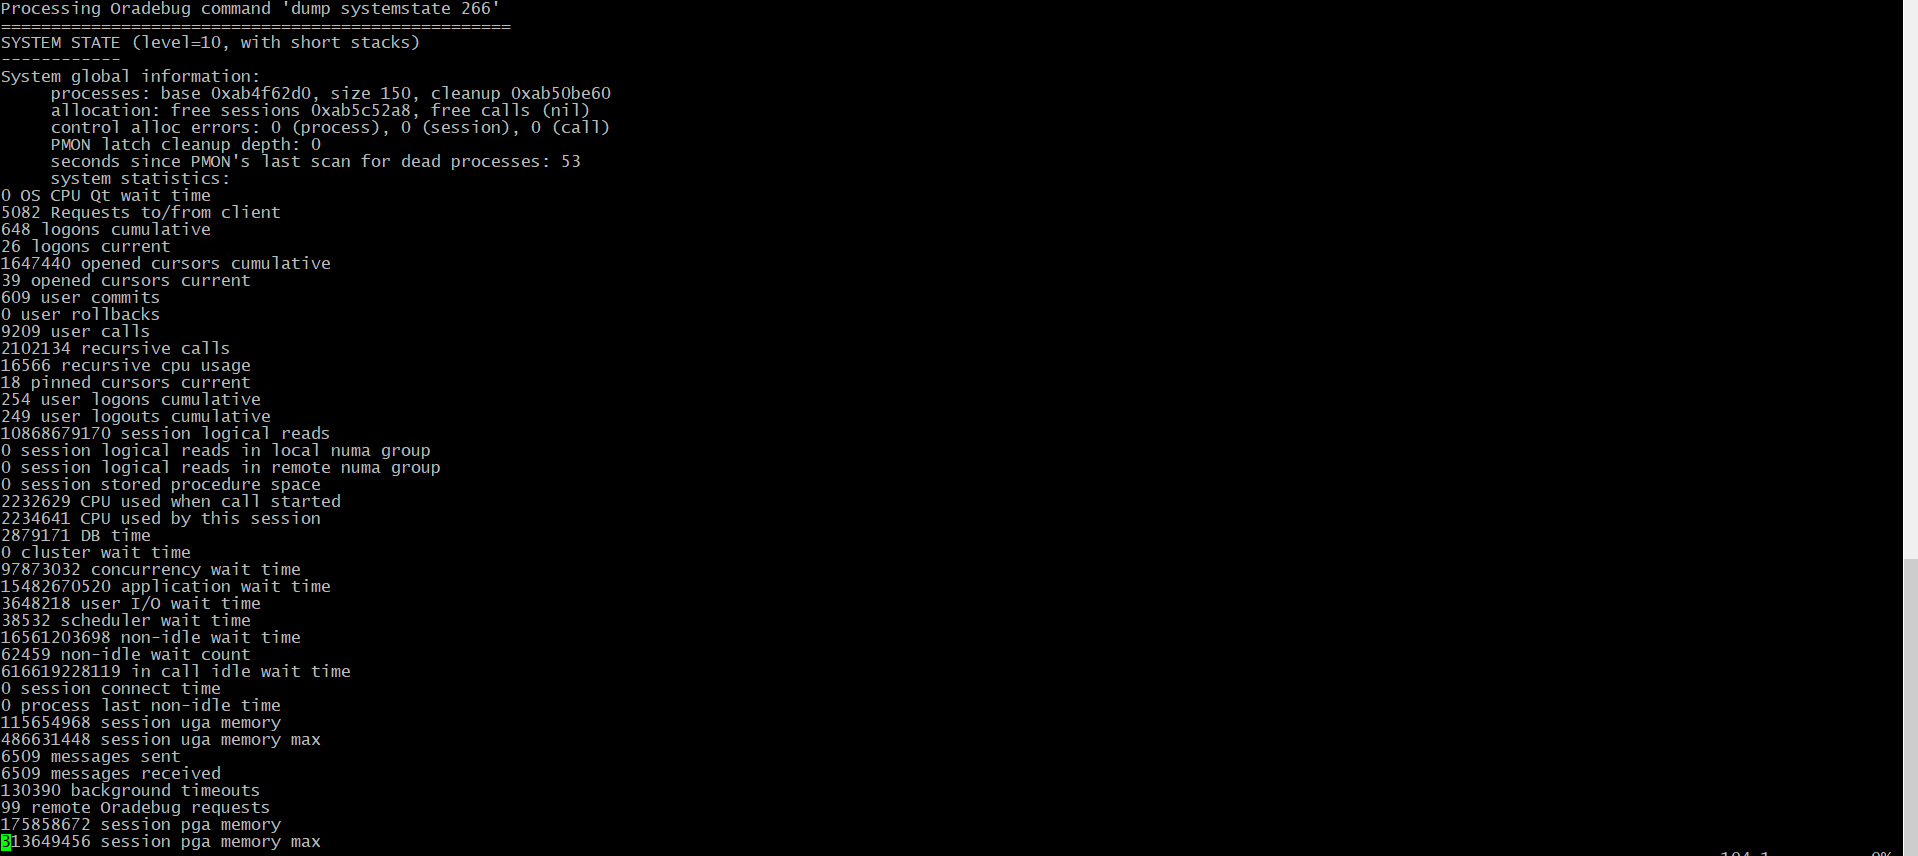
SQL> oradebug dump systemstate 266
Statement processed.
6. oradebug tracefile_name : tracefile_name 확인
SQL> oradebug tracefile_name
/ora_engine/diag/rdbms/ora11g/ORA11G/trace/ORA11G_ora_6187.trc
참고 1 https://dataonair.or.kr/db-tech-reference/d-lounge/technical-data/?mod=document&uid=235276
hang 문제를 해결하는 Systemstate dump
hang 문제를 해결하는Systemstate dump 오라클 데이터 서버를 운영하면서 hang현상이나 슬로우 퍼포먼스 문제를 만나게 되는 경우 v$session, v$process, v$session_wait,v$transaction, v$lock, dba_internal_locks, $latch, v$la
dataonair.or.kr
참고 2 https://grepora.com/2017/01/04/systemstate-dump/
SYSTEMSTATE DUMP
Hi guys! I already posted about Hang Analyze (part1, part2) and ASHDUMP. Now, in the same ‘package’, let me show you about SYSTEMSTATE DUMP. Systemstate is basically made by the process…
grepora.com
참고 3 https://web-dev.tistory.com/374
Oradebug 사용법
Oradebug 사용법 - 적절한 권한을 가진 DB USER 로 sqlplus 로 접속 - 반드시 덤프할 오라클 프로세스를 지정한 후 사용 - SYNTAX : SQL>oradebug command 일반 유저도 Try SQL> show user USER is "SCOTT" SQL> oradebug setmypid O
web-dev.tistory.com
trace file 분석
[ora11g@oraclevm ~]$ vi /ora_engine/diag/rdbms/ora11g/ORA11G/trace/ORA11G_ora_6187.trc
- DB hang을 유발하는 A session

- A session이 잡고있는 blocking session

-DB hang을 유발하는 B session

- system 상세 정보 부분
> 해당 session별로 상세 내용은 process id number로 find
> hanganalyze process 는 1번 시작하며 oracle 프로세스 별로 수행하고 있는 정보들 확인 가능

- A session process 검색
vi 편집기 내부에서
/PROCESS process number

- A session process 기준으로 session 검색
- client details, sql hex code, psql hexcode 확인
vi 편집기 내부에서
/session)
(session) sid: 197 ser: 71 trans: 0xa8f3aee0, creator: 0xab52a338
flags: (0x41) USR/- flags_idl: (0x1) BSY/-/-/-/-/-
flags2: (0x40009) -/-/INC
DID: , short-term DID:
txn branch: (nil) edition#: 100 oct: 7, prv: 0, sql: 0xaa78ca68, psql: 0xa1e6ec10, user: 0/SYS
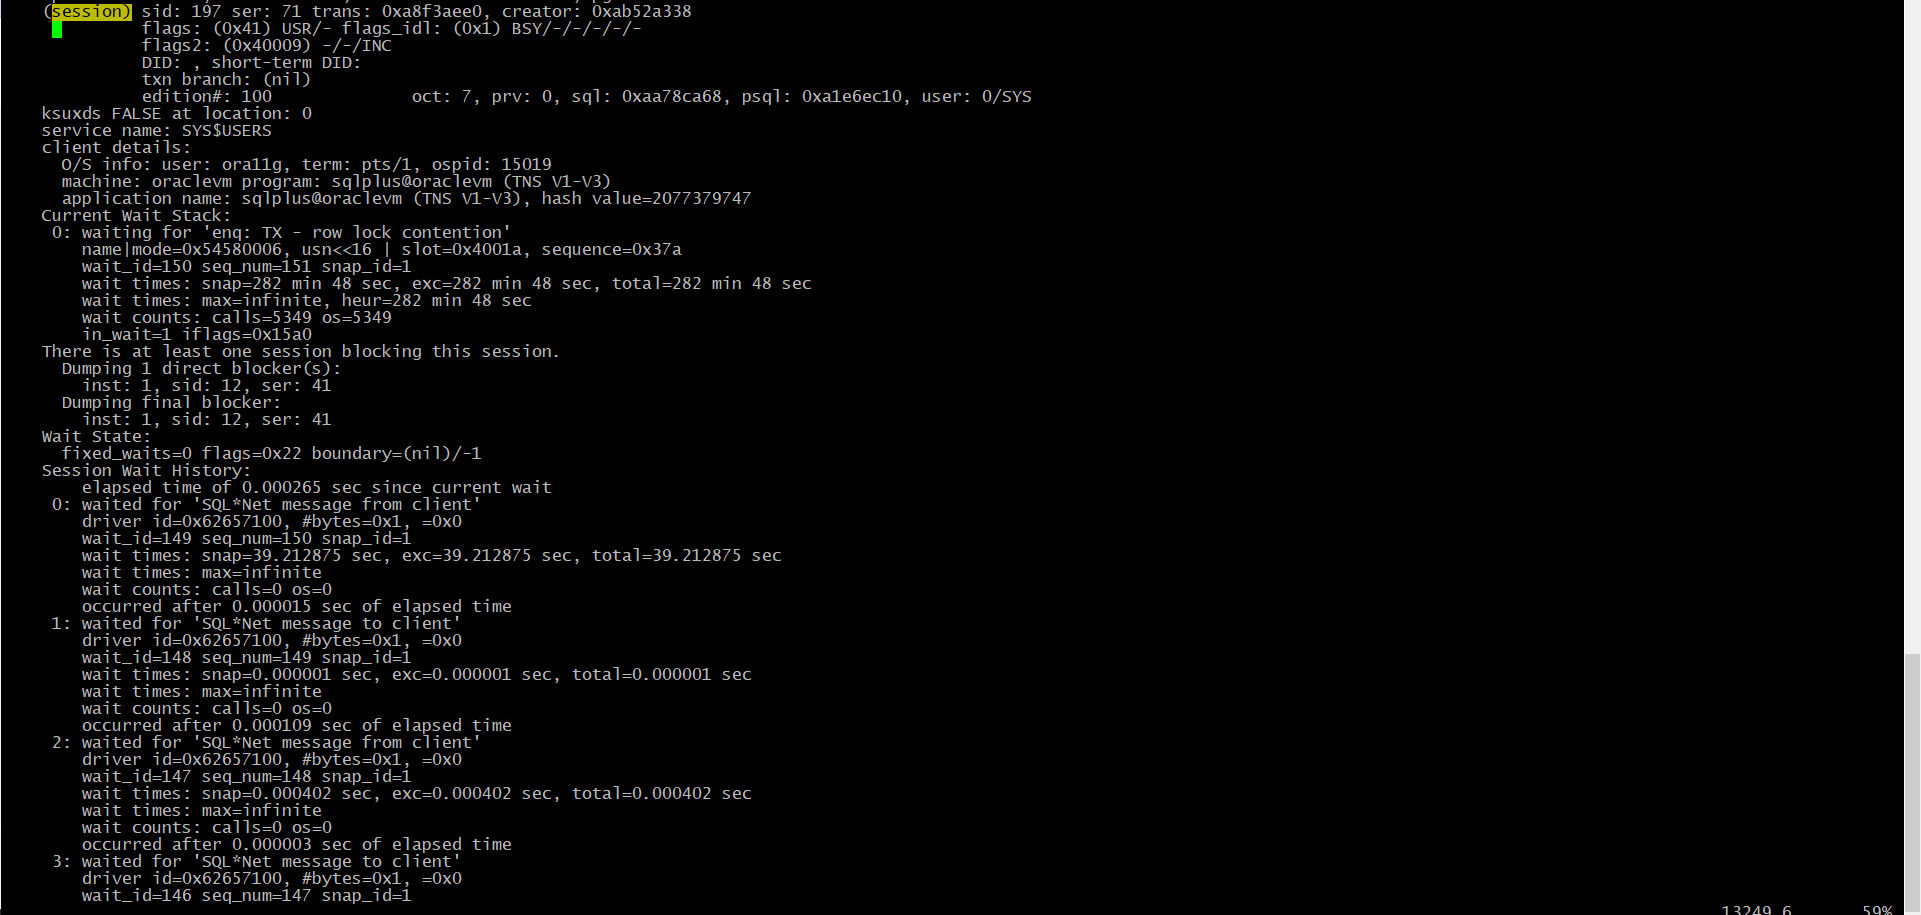
-출력된 hexcode 기준으로 어떤 sql이 수행되고 blocking 잡고있는지 검색
/aa78ca68
/a1e6ec10
1) /aa78ca68

2) /a1e6ec10

'DB > Oracle' 카테고리의 다른 글
| [RAC][INSTALL] 5_RAC 설치 후 추가 내용 (0) | 2023.03.02 |
|---|---|
| [ETC] sqlplus 옵션 및 spool (0) | 2023.02.17 |
| [ETC] Listener 자동 기동 스크립트 (0) | 2023.02.06 |
| [ADMIN] Datafile Storage 이동 작업 (1) | 2023.02.03 |
| [ADMIN] NETMGR을 통한 Listener 수동 설정 (0) | 2023.02.02 |
위 분석 방법은 정확한 내용이 아닌 테스트를 통해 개념정리입니다.
테스트 환경
- OS : Centos 7.9
- DB : Oracle 11.2.0.4
테스트 시나리오
- enq Tx - row lock entention 발생시킴
- dba_objects 2개 이상 count로 조회하여 강제 I/O 발생
- oradebug로 trace 로그 분석
=> oradebug는 경우에 i/o를 많이 잡아먹기때문에 DB가 멈출수 있어 잦은 발생보다 필요로할때 추출하는 것이 제일 best
oradebug commands
SQL> oradebug help

HELP           [command]                 Describe one or all commands
SETMYPID                                 Debug current process
SETOSPID       <ospid>                   Set OS pid of process to debug
SETORAPID      <orapid> ['force']        Set Oracle pid of process to debug
SETORAPNAME    <orapname>                Set Oracle process name to debug
SHORT_STACK                              Get abridged OS stack
CURRENT_SQL                              Get current SQL
DUMP           <dump_name> <lvl> [addr]  Invoke named dump
PDUMP          [interval=<interval>]     Invoke named dump periodically
               [ndumps=<count>]  <dump_name> <lvl> [addr]
DUMPSGA        [bytes]                   Dump fixed SGA
DUMPLIST                                 Print a list of available dumps
EVENT          <text>                    Set trace event in process
SESSION_EVENT  <text>                    Set trace event in session
DUMPVAR        <p|s|uga> <name> [level]  Print/dump a fixed PGA/SGA/UGA variable
DUMPTYPE       <address> <type> <count>  Print/dump an address with type info
SETVAR         <p|s|uga> <name> <value>  Modify a fixed PGA/SGA/UGA variable
PEEK           <addr> <len> [level]      Print/Dump memory
POKE           <addr> <len> <value>      Modify memory
WAKEUP         <orapid>                  Wake up Oracle process
SUSPEND                                  Suspend execution
RESUME                                   Resume execution
FLUSH                                    Flush pending writes to trace file
CLOSE_TRACE                              Close trace file
TRACEFILE_NAME                           Get name of trace file
SETTRACEFILEID <identifier name>         Set tracefile identifier
LKDEBUG                                  Invoke global enqueue service debugger
NSDBX                                    Invoke CGS name-service debugger
-G             <Inst-List | def | all>   Parallel oradebug command prefix
-R             <Inst-List | def | all>   Parallel oradebug prefix (return output
SETINST        <instance# .. | all>      Set instance list in double quotes
SGATOFILE      <SGA dump dir>         Dump SGA to file; dirname in double quotes
DMPCOWSGA      <SGA dump dir> Dump & map SGA as COW; dirname in double quotes
MAPCOWSGA      <SGA dump dir>         Map SGA as COW; dirname in double quotes
HANGANALYZE    [level] [syslevel]        Analyze system hang
FFBEGIN                                  Flash Freeze the Instance
FFDEREGISTER                             FF deregister instance from cluster
FFTERMINST                               Call exit and terminate instance
FFRESUMEINST                             Resume the flash frozen instance
FFSTATUS                                 Flash freeze status of instance
SKDSTTPCS      <ifname>  <ofname>        Helps translate PCs to names
WATCH          <address> <len> <self|exist|all|target>  Watch a region of memory
DELETE         <local|global|target> watchpoint <id>    Delete a watchpoint
SHOW           <local|global|target> watchpoints        Show  watchpoints
DIRECT_ACCESS  <set/enable/disable command | select query> Fixed table access
IPC                                      Dump ipc information
UNLIMIT                                  Unlimit the size of the trace file
CALL           [-t count] <func> [arg1]...[argn]  Invoke function with arguments
CORE                                     Dump core without crashing process
PROCSTAT                                 Dump process statistics
oradebug 사용법
ORADUBUG는 ORACLE에서 제공하는 디버깅을 위한 목적으로 만들어진 유틸리티로 DB가 멈추거나 Hang 상태일 때 또는 ORA-600 에러가 발생했을 경우, 특정 프로세스가 루핑을 도는 것 또는 멈춰있는 것 같이 보일 때 관리자 권한으로 실행하여 사용할 수 있다. 즉, 프로세스, 세션, 메모리, SQL 등의 리소스를 덤프할 수있고, OS 디버거들과 비슷하게 오라클 레벨에서 CALL단위 디버깅 기능을 제공한다. 리소스를 개별로 덤프할 수 있으며 인스턴스를 덤프할 수 있으며 DB HANG 또는 크리티컬 장애 분석 시 사용된다. 반드시 덤프할 오라클 프로세스를 지정한 후 사용
- 다른 유저 세션으로 SQL Tracing 설정 가능
- 프로세스 일시중단
- 공유메모리와 세마포어 정보검색
- 새로 생성된 트레이스파일 closing
- 내부 구조 조작 및 dump 기능
- 프로세스 시동
oradebug 작업 과정
1. oradebug setmypid : 현재 오라클 프로세스로 디버그
SQL> oradebug setmypid
Statement processed.
2. oradebug unlimit : trace file size 제한 없이 설정
=> I/O 를 사용하기에 필요한 상황 외는 no recommend
SQL> oradebug unlimit
Statement processed.
3. oradebug setinst all : rac의 경우 instance 2개 이상이므로 해당 옵션 사용 (single일때는 필요 없음)
SQL> oradebug setinst all
Statement processed.
4. oradebug hanganalyze : 프로세스 또는 인스턴스 hang 진단 및 분석시 유용
: oradebug hanganalze <level>
: rac의 경우 oradebug --g def hanganalyze 옵션 사용
<hanganalyze level option>
* 1-2 - Only HANGANALYZE output, no process dump at all
* 3 - Level 2 + Dump only processes thought to be in a hang (IN_HANG state)
=> hang으로 추정되는 프로세스 덤프
* 4 - Level 3 + Dump leaf nodes (blockers) in wait chains (LEAF,LEAF_NW,IGN_DMP state)
=> wait chain의 blocker 프로세스
* 5 - Level 4 + Dump all processes involved in wait chains (NLEAF state)
=> wait chain의 모든 프로세스
* 10 - Dump all processes (IGN state)
=> 모든 프로세스 덤프
SQL> oradebug hanganalyze 3 Hang Analysis in /ora_engine/diag/rdbms/ora11g/ORA11G/trace/ORA11G_ora_6187.trc
<Hanganalyze trace file sections 설명>
- CYCLES : Deadlock 관계 세션들의 CHAIN
- BLOCKER OF MANY SESSIONS : 10개 이상의 세션을 blocking 하는 BLOCKER 제시
- OPEN CHAINS : 1개 이상의 타 세션들을 blocking 하는 세션이 포함된 WAIT CHAIN
- OTHER CHAINS : OPEN CHAIN 의 세션들과 간접적으로 관련있는 프로세스 리스트
- EXTRA INFORMATION : 덤프 레벨에 따른 프로세스 Errorstack 등의 추가 정보
STATE OF NODES : 모든 세션들 DEPENDENCY GRAPH
- IN_HANG - HANG
- IGN - IGNORE
- LEAF - A waiting leaf node
- LEAF_NW - A running leaf node
- NLEAF - STUCK
[세션 STATE 설명]
- IN_HANG : 심각한 상태로, 이 상태의 세션은 DEADLOCK 가능성이 있음.
- IGN and IGN_DMP : IDLE 상태이므로 ignore
- LEAF and LEAF_NW : 이 상태로 Wait Chain 의 가장 앞에 있으면, 해당 세션이 Blocker 세션
- NLEAF : STUCK 세션으로, 다른 세션이 리소스를 잡고 안 놓아 주는 상태로 Performance 이슈 일 가능성이 높음
5. oradebug dump systemstate <level>
: hang에 대한 원인 파악이 가능하도록 dictionary table 에 대한 정보가 담겨져 있는 스냅샷
: rac의 경우 oradebug -g all dump systemstate 옵션 사용
: hanganalyze 수행 후 1분뒤 systemstate를 출력해야 정확히 수집 됨
= alter session set events 'immediate trace name systemstate level <level option>';
<systemstate level option>
2 : dump (not including the lock element)
10 : dump
11 :dump + global cache of RAC
256 : short stack (function stack)
258 : 256 + 2 -> short stack + dump (not including the lock element)
266 : 256 + 10 -> short stack + dump
267 : 256 + 11 -> short stack + dump + global cache of RAC
SQL> oradebug dump systemstate 266
Statement processed.
6. oradebug tracefile_name : tracefile_name 확인
SQL> oradebug tracefile_name
/ora_engine/diag/rdbms/ora11g/ORA11G/trace/ORA11G_ora_6187.trc
참고 1 https://dataonair.or.kr/db-tech-reference/d-lounge/technical-data/?mod=document&uid=235276
hang 문제를 해결하는 Systemstate dump
hang 문제를 해결하는Systemstate dump 오라클 데이터 서버를 운영하면서 hang현상이나 슬로우 퍼포먼스 문제를 만나게 되는 경우 v$session, v$process, v$session_wait,v$transaction, v$lock, dba_internal_locks, $latch, v$la
dataonair.or.kr
참고 2 https://grepora.com/2017/01/04/systemstate-dump/
SYSTEMSTATE DUMP
Hi guys! I already posted about Hang Analyze (part1, part2) and ASHDUMP. Now, in the same ‘package’, let me show you about SYSTEMSTATE DUMP. Systemstate is basically made by the process…
grepora.com
참고 3 https://web-dev.tistory.com/374
Oradebug 사용법
Oradebug 사용법 - 적절한 권한을 가진 DB USER 로 sqlplus 로 접속 - 반드시 덤프할 오라클 프로세스를 지정한 후 사용 - SYNTAX : SQL>oradebug command 일반 유저도 Try SQL> show user USER is "SCOTT" SQL> oradebug setmypid O
web-dev.tistory.com
trace file 분석
[ora11g@oraclevm ~]$ vi /ora_engine/diag/rdbms/ora11g/ORA11G/trace/ORA11G_ora_6187.trc
- DB hang을 유발하는 A session
- A session이 잡고있는 blocking session
-DB hang을 유발하는 B session
- system 상세 정보 부분
> 해당 session별로 상세 내용은 process id number로 find
> hanganalyze process 는 1번 시작하며 oracle 프로세스 별로 수행하고 있는 정보들 확인 가능
- A session process 검색
vi 편집기 내부에서
/PROCESS process number
- A session process 기준으로 session 검색
- client details, sql hex code, psql hexcode 확인
vi 편집기 내부에서
/session)
(session) sid: 197 ser: 71 trans: 0xa8f3aee0, creator: 0xab52a338
flags: (0x41) USR/- flags_idl: (0x1) BSY/-/-/-/-/-
flags2: (0x40009) -/-/INC
DID: , short-term DID:
txn branch: (nil) edition#: 100 oct: 7, prv: 0, sql: 0xaa78ca68, psql: 0xa1e6ec10, user: 0/SYS
-출력된 hexcode 기준으로 어떤 sql이 수행되고 blocking 잡고있는지 검색
/aa78ca68
/a1e6ec10
1) /aa78ca68
2) /a1e6ec10
'DB > Oracle' 카테고리의 다른 글
| [RAC][INSTALL] 5_RAC 설치 후 추가 내용 (0) | 2023.03.02 |
|---|---|
| [ETC] sqlplus 옵션 및 spool (0) | 2023.02.17 |
| [ETC] Listener 자동 기동 스크립트 (0) | 2023.02.06 |
| [ADMIN] Datafile Storage 이동 작업 (1) | 2023.02.03 |
| [ADMIN] NETMGR을 통한 Listener 수동 설정 (0) | 2023.02.02 |